
Performance of CDF silicon
All plots on this page were made with data from the very first CDF Run 2 data-taking. Tracks have been found using a simple two dimensional algorithm. More details of this tracking can be found here.
Tracks in the detector
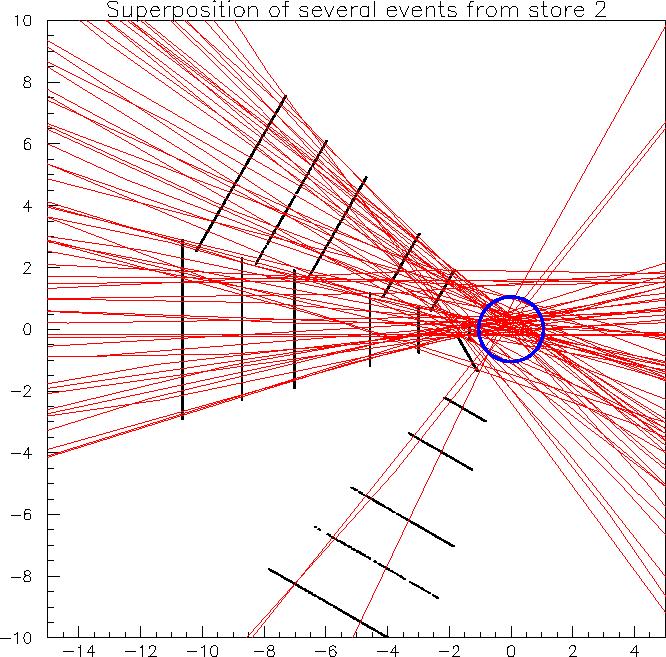
This image is from the very first data of Run2. Here only a portion of the silicon system was operational. The picture shows the active detector (black lines), and reconstructed tracks in red. The blue circle represents the beampipe.
Only tracks with a transverse momentum greater than 0.2 GeV are shown. The tracks have been reconstructed using a simple 2-d silicon stand-alone algorithm. (A better quality postscript version of this plot can be found here).
Track impact parameter resolution
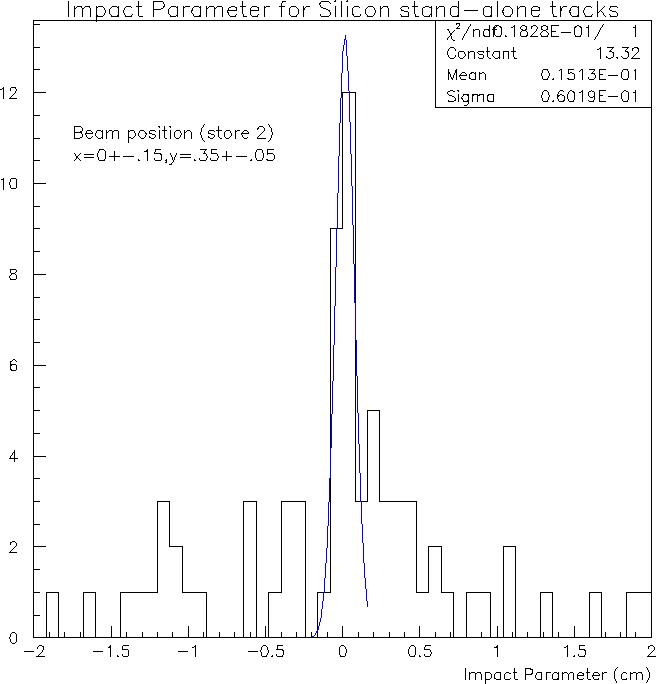
This plot shows the impact parameter resolution of the tracks in the above picture. (A better quality postscript version of this plot can be found here).
Track momentum distribution
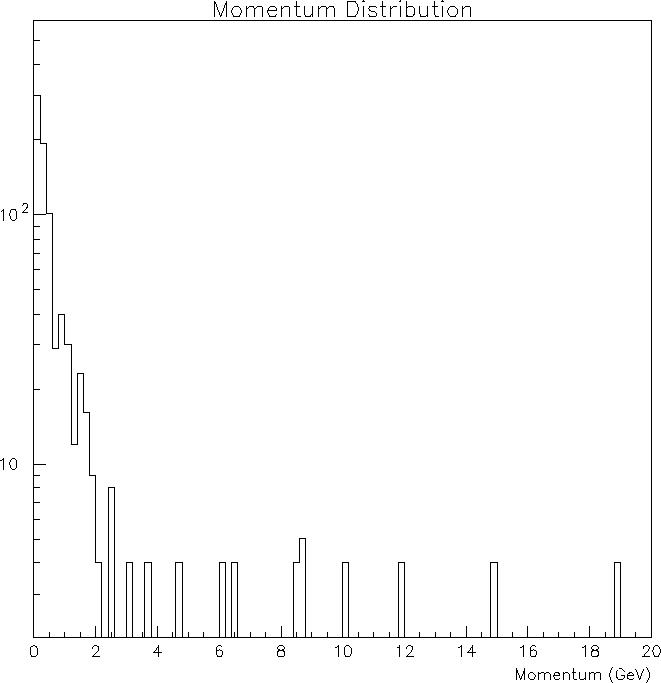
This plot shows the momentum distribution of the reconstructed tracks. (A better quality postscript version of this plot can be found here).