
Silicon Alignment
A method for aligning the entire silicon system has been developed.
It is based on the Millepede minimisation program of Volker Blobel.
Our procedure and results are described in CDF Note 5700 sentitled "A Procedure for the Software Alignment of the CDF Silicon System".
You can view the transparencies shown at the Commissioning Meeting on August 23rd 2001, either as a postscript file or, if you are feeling adventurous, as a powerpoint presentation.
Data have been used to align the SVX detector. Results were presented t the tracking meeting on July 10th 2002.
Here are plots of the bow deformations as described in the survey (red) and after the alignment procedure (green).
The L00 alignment was described at the Tracking Meeting on Nov 6th. Resolutions are somewhat worse than might be expected. Currently we suspect we are not correctly picking up the calibrations for the common-mode correction.
Silicon Monitoring
See the SiliMon link at Fermilab
Layer00 design
Sensor design and specifications
- Overview
- Specifications
- Results
Mechanical design
Archived links
Performance of CDF silicon
All plots on this page were made with data from the very first CDF Run 2 data-taking. Tracks have been found using a simple two dimensional algorithm. More details of this tracking can be found here.
Tracks in the detector
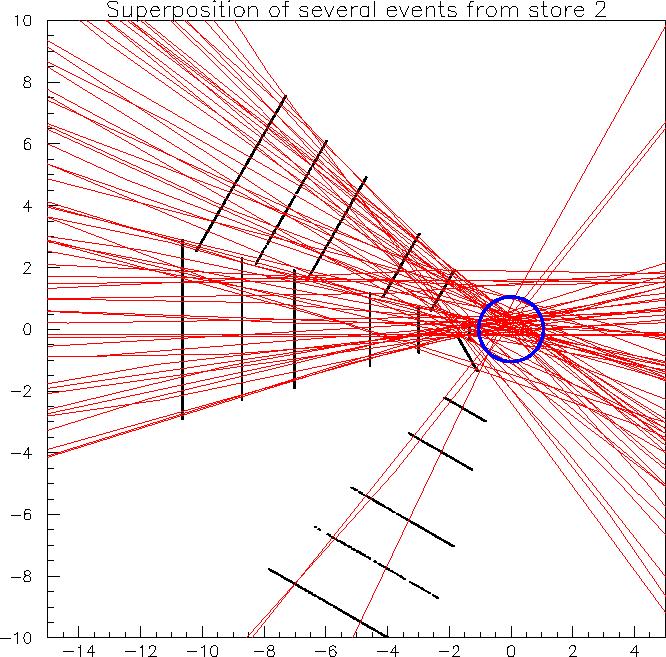
This image is from the very first data of Run2. Here only a portion of the silicon system was operational. The picture shows the active detector (black lines), and reconstructed tracks in red. The blue circle represents the beampipe.
Only tracks with a transverse momentum greater than 0.2 GeV are shown. The tracks have been reconstructed using a simple 2-d silicon stand-alone algorithm. (A better quality postscript version of this plot can be found here).
Track impact parameter resolution
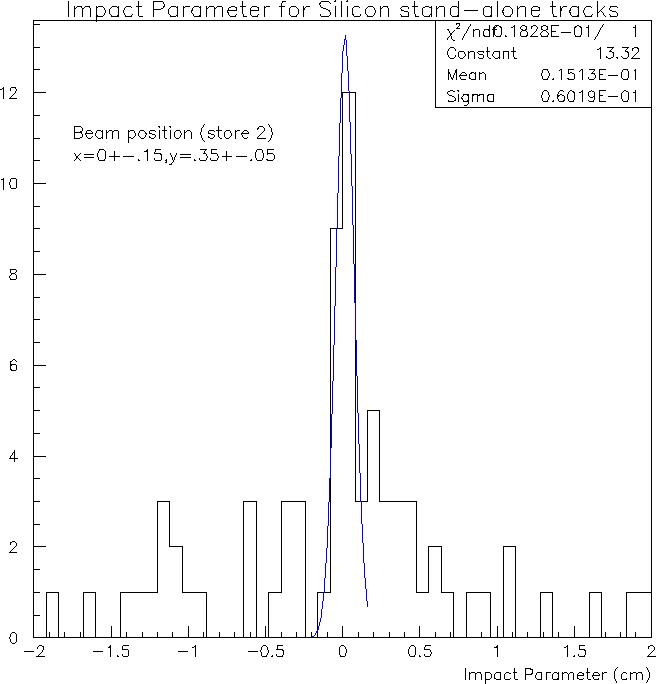
This plot shows the impact parameter resolution of the tracks in the above picture. (A better quality postscript version of this plot can be found here).
Track momentum distribution
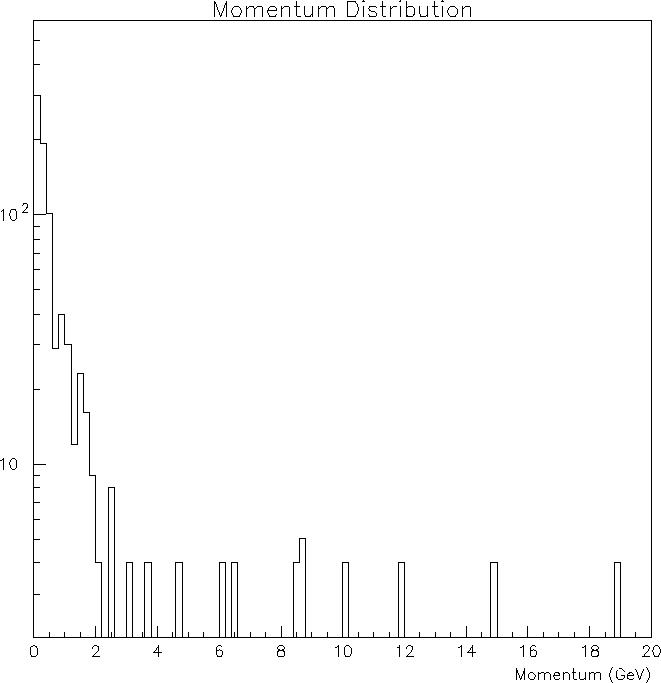
This plot shows the momentum distribution of the reconstructed tracks. (A better quality postscript version of this plot can be found here).
Run 2b Layer0
Here are six pictures of the Run2b Layer0 Carbon Fibre mould tool.
Here are four pictures of the first prototype outer carbon fibre skin.