Next: Single Crystal FeO Thin Up: Printer Toner Powders Previous: Introduction Contents
All of the room temperature spectra showed that the iron oxide content was not pure Fe![]() O
O![]() . In pure Fe
. In pure Fe![]() O
O![]() there is a distinctive ratio between the intensity of the two spectral components. This ratio,
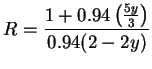
there is a distinctive ratio between the intensity of the two spectral components. This ratio, ![]() , should equal 1:1.88 (A:B).8.1 In all cases for the toner samples
, should equal 1:1.88 (A:B).8.1 In all cases for the toner samples ![]() was greater than this. This indicated another iron oxide being present and comparison with the example spectra in Reference dacosta_95 shows this to be
was greater than this. This indicated another iron oxide being present and comparison with the example spectra in Reference dacosta_95 shows this to be ![]() -Fe
-Fe![]() O
O![]() (maghemite). In this case we can use the areas of the two components to calculate the Fe
(maghemite). In this case we can use the areas of the two components to calculate the Fe![]() /Fe
/Fe![]() ratio and the Fe
ratio and the Fe![]() O
O![]() /Fe
/Fe![]() O
O![]() ratio.
ratio.
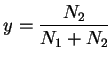
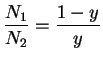
Taking ![]() as the the proportion of Fe
as the the proportion of Fe![]() O
O![]() to the whole (between 0, pure Fe
to the whole (between 0, pure Fe![]() O
O![]() , and 1, pure Fe
, and 1, pure Fe![]() O
O![]() )
)
Laporte supplied five samples for study: two of their own (L1 and L2) and three competiting brands (C1, C2 and C3). No information was given concerning the composition of any of the samples. The room temperature Mössbauer spectra obtained from these samples are shown in Figure 8.1 and the fitting parameters in Table 8.1.
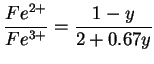
Using Equations 8.2 and 8.3 the ratio of Fe![]() to Fe
to Fe![]() can be calculated. These values are shown in Table 8.2. Rearranging Equation 8.1 to obtain the ratio of atoms,
can be calculated. These values are shown in Table 8.2. Rearranging Equation 8.1 to obtain the ratio of atoms, ![]() :
:![]() , gives the relation
, gives the relation
Mössbauer spectra were recorded from the same samples at
![]() . These spectra are shown in Figure 8.2.
. These spectra are shown in Figure 8.2.
At
![]() the samples are below the Verwey transition temperature,
the samples are below the Verwey transition temperature, ![]() , of
, of
![]() . The single B site component has now become two separate components for
. The single B site component has now become two separate components for ![]() and
and ![]() ions. The hyperfine fields for Fe
ions. The hyperfine fields for Fe![]() A sites and Fe
A sites and Fe![]() B sites in magnetite and the Fe
B sites in magnetite and the Fe![]() A and B sites all lie close to each other, meaning they overlap in the spectrum. This, combined with the broad linewidth of the Fe
A and B sites all lie close to each other, meaning they overlap in the spectrum. This, combined with the broad linewidth of the Fe![]() B site makes these data much less reliable for accurate assessment of area ratios than the room temperature spectra. Thus the final results were based on the room temperature fits only.
B site makes these data much less reliable for accurate assessment of area ratios than the room temperature spectra. Thus the final results were based on the room temperature fits only.
Dr John Bland, 15/03/2003
![\includegraphics[scale=0.7,angle=0]{oxides_figs/laporte_all_rt}](img950.png)
![\includegraphics[scale=0.7,angle=0]{oxides_figs/laporte_all_77k}](img951.png)