A comparison of capacitance against pitch
Several cable geometries have been simulated using the MAXWELL (TM) Electromagnetic simulation software package. In this study, the 2-dimensional electrostatic solver was used to compute the capacitance matrices corresponding to the different cable geometries. The capacitance of the central strip was calculated by simulating the geometry corresponding to a 6 cell structure consisting of the central strip, the near neighbour (NN), far-neighbour (NNN) and edge strips.
The geometry of each cable is defined using a mouse-based drawing package and the material properties and boundary conditions are assigned. The solver then computes the spatial distribution of the electrical potential for a configuration with 1 V on the central strip and 0 V on all other electrodes.
The MAXWELL program solves the problem using an iterative procedure involving the automatic refinement of the mesh geometry according to need. The calculation is terminated when a pre-defined change in the total energy of the system (0.1 %) is reached between successive iterations. The capacitance matrix is then calculated.
The capacitances were measured using a Wayne-Kerr 6235 precision component analyser operated in parallel capacitance/resistance mode at 300 kHz. The total capacitance (Total) was measured between a single strip and its nearest and next neareset neighbours. Capacitances were then measured between the single strip and its nearest neighbours (C_NN) with the next-nearest grounded and similarly the next nearest (C_NNN) were measured with the nearest grounded.
| Cable length | 65 mm | Strip pitch | 0.05 mm |
| Electrode Width | 0.02 mm | Electrode Thickness | 0.005 mm |
| Substrate Thickness | 0.50 mm | Substrate Permitivity | 3.5 |
| Measured (pF/cm) | Calculated (pF/cm) | |
|---|---|---|
| Total | 0.48 +/- 0.03 | 0.47 |
| C_NN | 0.31 +/- 0.02 | 0.35 |
| C_NNN | 0.09 +/- 0.01 | 0.08 |
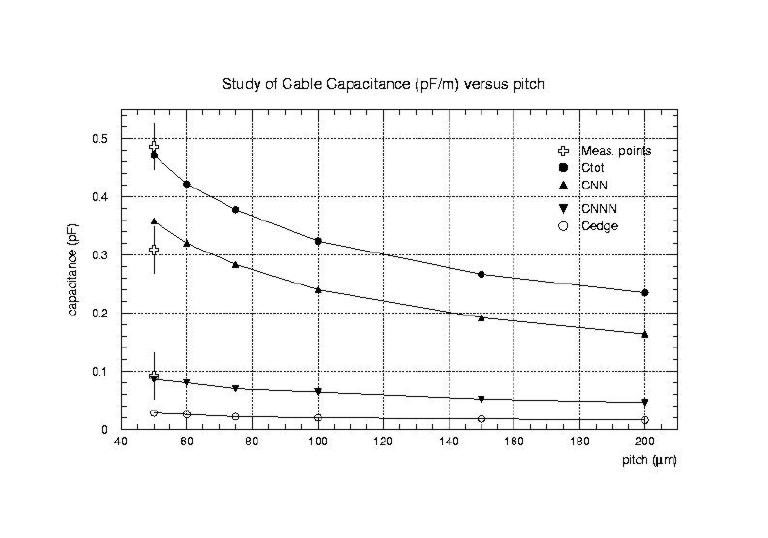
The prototype L00 cable was measured and found to be in agreement with the simuation. Using the simulation, capacitance values at varying strip pitches can be calculated.
The electrostaic model was then compared against a number of other cables.
| Cable length | 305 mm | Strip pitch | 0.5 mm |
| Electrode Width | 0.14 mm | Electrode Thickness | 0.02 mm |
| Substrate Thickness | 0.18 mm | Substrate Permitivity | 3.5 |
| Measured (pF/cm) | Calculated (pF/cm) | |
|---|---|---|
| Total | 0.34 +/- 0.02 | 0.34 |
| C_NN | 0.23 +/- 0.01 | 0.25 |
| C_NNN | 0.08 +/- 0.01 | 0.05 |
| Cable length | 85 mm | Strip pitch | 1.5 mm |
| Electrode Width | 1.15 mm | Electrode Thickness | 0.02 mm |
| Substrate Thickness | 0.13 mm | Substrate Permitivity | 3.5 |
| Measured (pF/cm) | Calculated (pF/cm) | |
|---|---|---|
| Total | 0.58 +/- 0.04 | 0.49 |
| C_NN | 0.45 +/- 0.03 | 0.43 |
| C_NNN | 0.08 +/- 0.01 | 0.04 |
I) The Maxwell Simulation package has been successfully compared with several different cable geometries and pitches.
II) Using the extrapolation as shown in the plot, the capacitance for a single cable of 0.33 pF/cm is to be expected for 100 micron pitch.
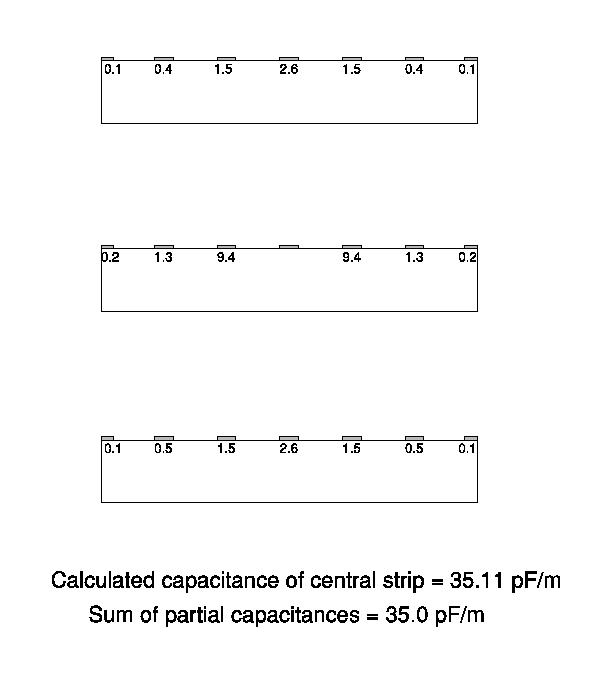
III) The effects of stacking the cables has also been modelled for a cable of type A at 100 micron pitch. The simultion was performed by varying the air gap between cables.
| Electrode | 0.25 mm gap | 0.15 mm gap | 0.1 mm gap | 0.05 mm gap |
| C(total) | 0.331 pF/cm | 0.335 pF/cm | 0.351 pF/cm | 0.386 pF/cm |
| C(upper) | 0.026 pF/cm | 0.049 pF/cm | 0.066 pF/cm | 0.115 pF/cm |
The plot below shows the geometry and the capacitances between the centre strip of the middle layer and all the surrounding strips in pF/m.