Tube tests
In principle, if the SCT barrel is completely covered in foil then at high frequencies, common mode current brought into the tracker by cabling and cooling tubes should tend to flow in the lowest impedance path formed by the foil. Even if tubes penetrate the screening foil and are electrically connected to it at each end of the foil the majority of the current should still flow in the foil.
In the forward detector it is proposed to augment the connection between the modules via the cooling tubes with a foil plane or strip between the cooling points to lower the inductance of the connection with the intention of keeping the potentials between any two modules to a minimum.
A series of simple tests were performed to verify that these are correct assumptions is by measuring the inductance and resistance of different loops formed from 5.2mm OD tube and the effect of shunting part of the loop with a 20 um aluminium foil. A simple pickup loop was also used to monitor the magnetic field around the tube with and without a screening foil in place.
The aluminium tube was formed into sections, which were joined by short 2 cm aluminium rods with tapered ends. This allowed various configurations to be tried. The aluminium rods were short and of the same diameter as the tube so should not make a significant difference to the results.
Setup with tube only
Setup with tube and foil
An Agilent 4285A precision LCR meter was used to measure the inductance and resistance of the various loops. This device is capable of measuring at frequencies between 75 KHz and 30 MHz. In these tests it was found that there were no significant differences between measurements at 75 and 100 KHz so 100 KHz was used as the lower limit. At higher frequencies, above 10 MHz it was found that readings were nonsensical, giving negative resistance values. Despite trimming the instrument with various arrangements of connections and leads this could not be eliminated. The documentation for the instrument notes that a different calculation is used for frequencies above 5 MHz and this is a possible source of the error. Note also that the resistance of the setup will be small very small compared to the inductive reactance at high frequencies Quite possibly, the fact that this is a large structure with significant capacitance to infinity accounts for some the errors seen and this is complemented by the observation that a hand placed near the setup changes the resistance readings appreciably. Consequently the upper limit for the measurements was taken as 10 MHz. The LCR meter works by passing a current through the device under test and measuring the phase and magnitude of the voltage across it. This is convenient for our purposes as we have a variable frequency signal source with accurately monitored current.
One limitation is that the meter automatically selects the current at higher frequencies so the current is not constant at different frequencies. A simple correction needs to be made to the measured pickup voltage to scale to the standard 22mA at lower frequencies.
A pickup loop was made to monitor the magnetic field around the tube.
This consists of a single loop of coaxial cable wrapped around a non-magnetic epoxy-glass former. At one end of the coax the screen and the centre conductor are shorted together and taken to the shell of a BNC connector, at the other end of the coax loop the centre conductor is taken to the signal pin of the BNC connector. This gives a pickup loop, which is relatively insensitive to electric fields due to the screen, whilst the loop formed by the inner of the coax is sensitive to magnetic fields. The loop is then connected by a coax to the scope input. The scope input impedance is set to the 1 Mohm range so that the loop impedance at high frequencies is still small by comparison. A potential inaccuracy in this configuration will occur at high frequencies as the capacitance of the scope input and the cable will load the voltage signal. Which will tend to give a lower reading.
An additional 8 cm by 8 cm square loop of enamelled copper wire (not shown in the diagrams) placed in the bottom RH corner of the radiating loop was used to pick up a large magnitude signal to trigger the scope.
A Le Croy 9374TM scope was used to monitor the signal from the pickup loop. One small problem with using the LCR meter is that the output amplitude of the meter is not constant. It appears to scan a number of amplitudes and presumably averages the result. This can make triggering and measuring the amplitude of the signal in the pickup loop difficult. The method adopted was to set the frequency range of the meter and to adjust the scope trigger level until the trigger rate was very low such that the scope only triggered when the signal from the pickup loop was near the maximum amplitude. These signals were then averaged and the amplitude read from the parameters screen It was also found that at very small pickup levels the scope did not calculate the correct RMS level of the signal relative to the p-p value which should be constant for a sinusoidal signal hence I have some doubt about the accuracy of the numbers below 1 mV. (I started by recording RMS values and changed to using p-p values when I found this problem.)
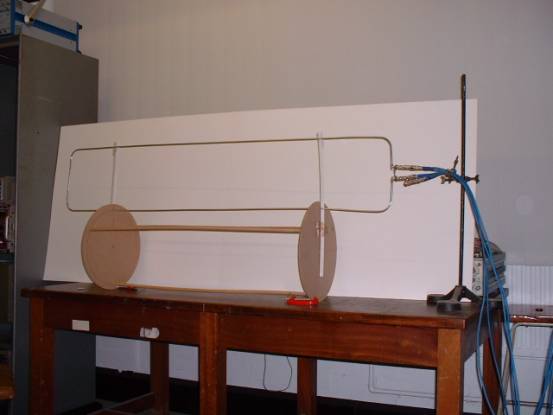
The first measurements were made with a large loop as shown in figure 1
Figure 1 Loop of tube – ignore pickup loop dimensions and refer to pickup loop diagram
|
Frequency |
Voltage (mV) |
Current (mA) |
Rs (ohms) |
Ls (uH) |
Vscope (mV) |
|
10 MHz |
1024 |
5.587 |
13.78 |
2.87 |
26.6 ( 105)* |
|
5 |
884 |
9.175 |
0.335 |
3.03 |
24.4 (58.5)* |
|
1 |
426 |
22 |
0.084 |
3.04 |
8.6 |
|
0,5 |
214 |
22 |
0.047 |
3.05 |
7.0 |
|
0.1 |
42 |
22 |
0.006 |
2.96 |
2.5 |
* note Numbers in brackets are corrected for 22 mA drive current
From the results above it can be seen that the inductance is reasonably constant over the 0.1 - 10.MHz band
The skin effect explains the measured increase in the resistance with frequency as the current travels in a smaller depth of the metal, although the 10MHz value for the resistance is probably erroneous due to the inductive reactance becoming much greater than the resistance. (XL ~= 200 ohms at 10MHz).
The pickup voltage on the scope broadly follows the expected linear dependence on frequency.
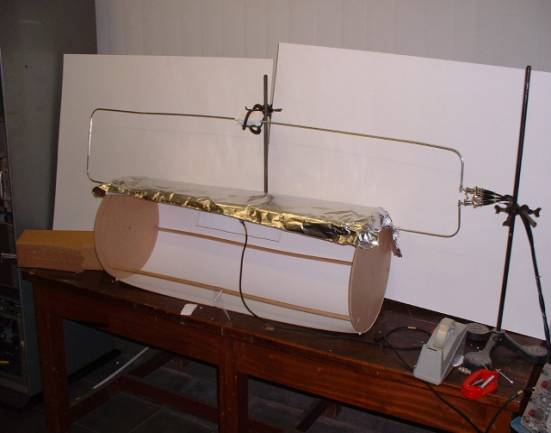
A second set of measurements were performed with a setup as in figure 2
Figure 2 Loop of tube plus foil – ignore pickup loop dimensions and refer to pickup loop diagram
Here a sheet of 20 um Aluminium foil was placed on a 36 cm diameter former made from wood and card. The tube of the lower part of the loop was placed 3 cm inside the former. Connections at either end of the foil at points A and B could be made between the foil and the tube. These connections were made with 3 cm wide foil
strips wrapped around the tube and secured with clips.
Measurements were made with no connections at A or B, just at A, and both A and B.
. Foil on former
but no connection at A or B
|
Frequency |
Voltage (mV) |
Current (mA) |
Rs (ohms) |
Ls (uH) |
Vscope (mV p-p) |
|
10 MHz |
1020 |
5.836 |
13.17 |
2.74 |
27.36 ( 103.1)* |
|
5 |
874.6 |
9.522 |
0.320 |
2.885 |
21.00 (48.51)* |
|
1 |
407 |
22 |
0.035 |
2.901 |
11.00 |
|
0,5 |
203.9 |
22 |
0.047 |
2.906 |
6.70 |
|
0.1 |
40.96 |
22 |
0.018 |
2.916 |
1.57 |
Foil connected only at end A
|
Frequency |
Voltage (mV) |
Current (mA) |
Rs (ohms) |
Ls (uH) |
Vscope (mV p-p) |
|
10 MHz |
1.019 |
6.083 |
10.53 |
2.624 |
26.86 (97.14)* |
|
5 |
NR |
NR |
-0.64 |
2.747 |
18.16 ( NC)* |
|
1 |
404.7 |
22 |
0.094 |
2.885 |
10.72 |
|
0,5 |
203 |
22 |
0.055 |
2.894 |
6.56 |
|
0.1 |
40.87 |
22 |
0.022 |
2.910 |
1.76 |
Note the negative resistance value at 5 MHz. This I think is due to a resonance in the setup as it was possible to change the value of negative resistance by moving the foil away from or closer to the tube at the open circuit end.
NR means not recorded NC means not calculable
Foil connected both ends
|
Frequency |
Voltage (mV) |
Current (mA) |
Rs (ohms) |
Ls (uH) |
Vscope (mV p-p) |
|
10 MHz |
1.015 |
7.322 |
10.635 |
2.160 |
1.78 (5.34)* |
|
5 |
624.5 |
11.65 |
0.301 |
2.214 |
0.71 (1.34)* |
|
1 |
317.9 |
22 |
0.221 |
2.259 |
0.79 |
|
0,5 |
160 |
22 |
0.135 |
2.269 |
0.77 |
|
0.1 |
32,6 |
22 |
0.072 |
2.310 |
0.47 |
Foil connected at both ends and tube open circuit at A
|
Frequency |
Voltage (mV) |
Current (mA) |
Rs (ohms) |
Ls (uH) |
Vscope (mV p-p) |
|
10 MHz |
1.014 |
7.299 |
10.92 |
2.165 |
1.80 (5.43)* |
|
5 |
825.0 |
11.56 |
0.390 |
2.233 |
0.84 (1.56)* |
|
1 |
320.6 |
22 |
0.210 |
2.276 |
0.77 |
|
0,5 |
161.0 |
22 |
0.155 |
2.285 |
0.78 |
|
0.1 |
32.89 |
22 |
0.095 |
2.320 |
0.78 |
NOTE * denotes pickup voltage normalised to 22 mA drive current